SCAView-Docs
Documentation for SCAView
Get access
All members of the Ataxia Global Initiative are granted access to SCAview. Further details how to apply for AGI membership can be found here.
The viewer
Generating a plot
On the left upper side you can add a plot by clicking the Add button. After that a plot with default settings is showing up in the middle. You can further add plots by repeating the prior. By clicking on a plot you focus it. Once a plot is focused you can select the options:
- Plot type (Scatter, Bar, Histogram, Timeline)
- X Variable (Variable on the x-axis)
- Y Variable (Variable on the y-axis, only applicable for Scatter and Timeline)
- Color Item (Variable to color the datapoints, can be discrete (e.g. Genotype) or numerical (e.g. SARA sum score))
- Time span of a visit (Select how many days between two observations you allow to consider them as observed in one visit)
- Visit (Select which visits you want to observe: All visits, first visits or follow-up visits. Whn selecting follow-up you can select the time (in months) after the first visit and a tolerance that allows for instance to include 13 month follow-up to consider within the yearly follow-up )
- Fit (Adds a linear regression line to the plots)
- Legend (Whether or not you want to have plots to have a legend)
Filtering the current population
All plots allow to draw a rectangle into the plots to select a filter. Note that filters are always applied globally which means the filter you select for Plot 1 will also be applied to Plot 2. Once yoou select a filter the current population gets reduced accoring to the filter. Generally you have the option to filter patient-wise or visit-wise. Patient-wise filtering means to include all observations for a certain patient into the current sub-population if the patient has at least one observation that fits the filter. Visit-wise filtering means that you only select those visits from each patient that match the current filter. Furthermore, you can see the current filters and can edit or delete them. Re-drwing a rectangle over the current filter updates the current filter.
Saving the current filter
If you have a filter setting that you want to persist in the current session you can save it as a subgroup by giving it a name and then click Define. This subgroup can then be re-applied (after removing the current filter) to your plots by clicking on the sub-group name listed on the bottom of the filter settings box.
Reseting a filter
You can delete the sub-groups by clicking on the garbage can icon right next to the sub-group name. The complete session can be reset by clicking on Reset Session.
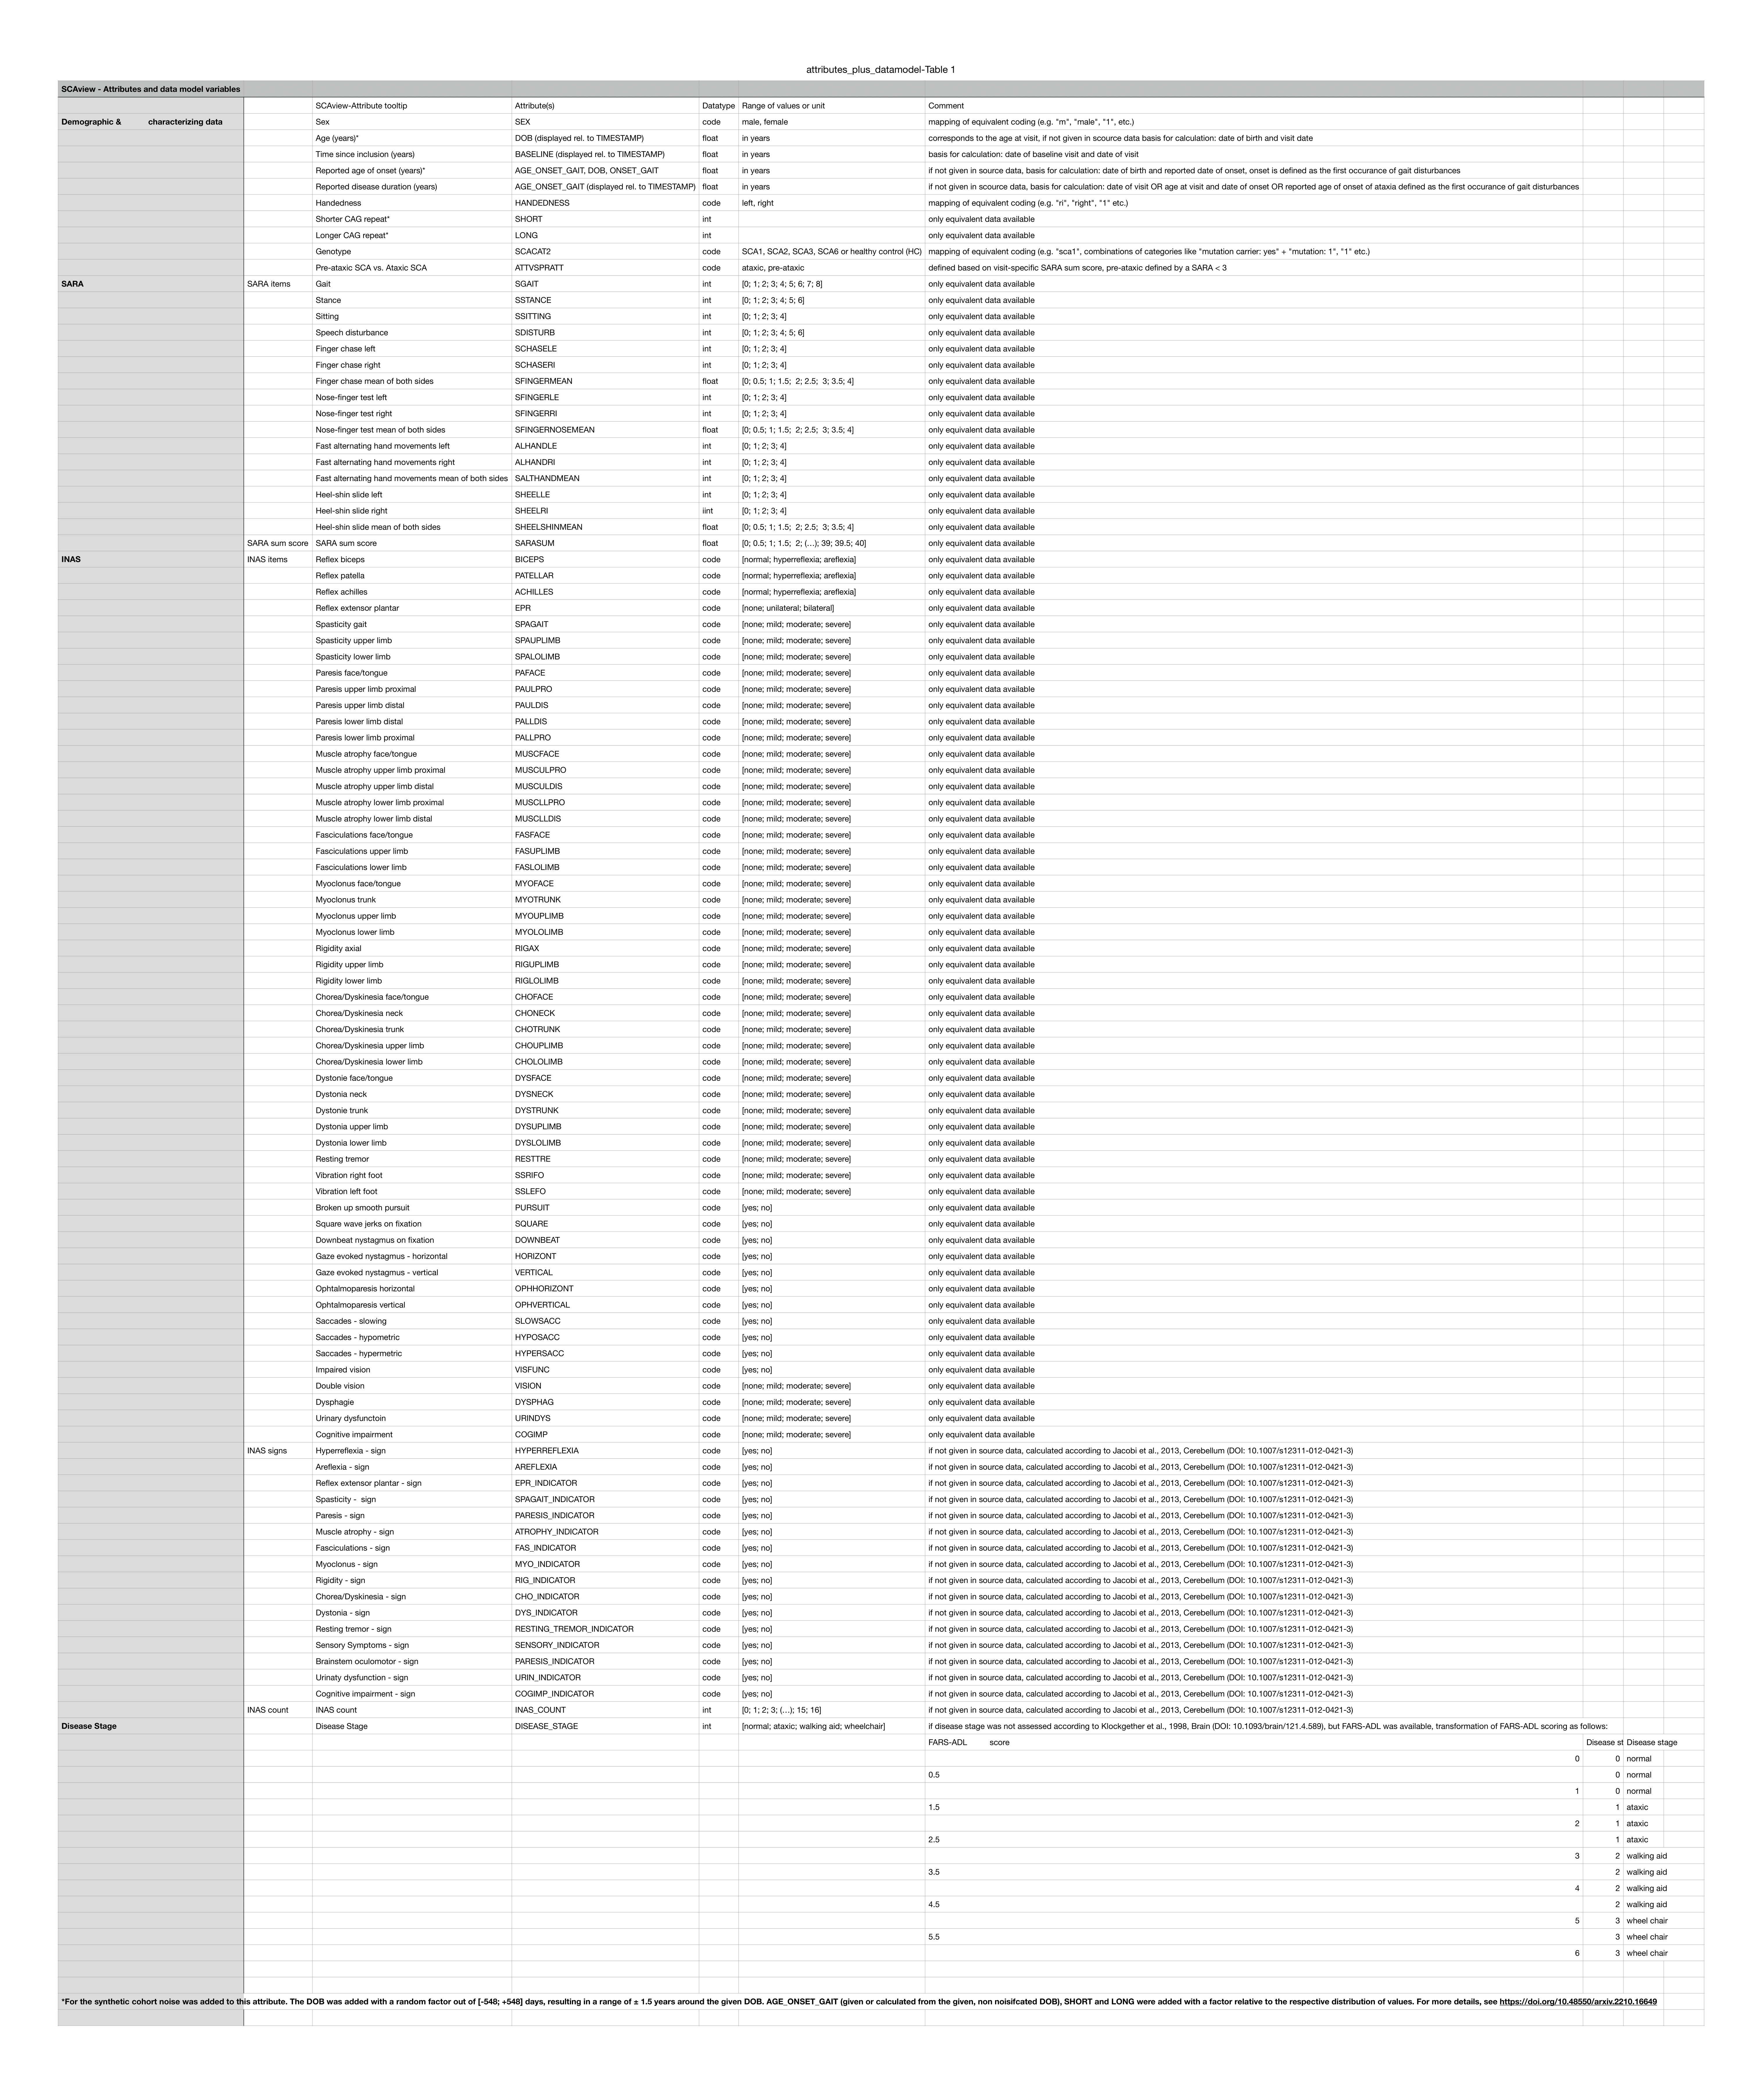
Datamodel
Issues
If you run into any further issues please use the issue board: https://github.com/DZNE-ataxia-research/SCAView-Docs/issues